The Big Unwind: After Messing up the Housing Market, the “Smart Money” Bails Out
by Wolf Richter •


Housing Bubble 2: Sales to institutional investors plunge to lowest level since 2010
In real estate, particularly in housing, national averages elegantly paper over the gritty details on the ground in specific metro areas and neighborhoods. When a new trend starts in some locations, it’s neutered by data from other locations. Blips and squiggles are averaged out of the picture. But by the time changes consistently show up in national averages, they’ve taken on serious weight on the ground. And now the “smart money” – smart because it has access to the Fed’s free moolah – is abandoning the housing market.
Wall Street money entered the housing market gingerly in 2010 and 2011, then piled helter-skelter into select metro areas over the next two years, grabbing vacant single-family homes out of foreclosure with the goal of first renting them out, then selling to yield-desperate investors and unsuspecting mutual-fund holders their latest toxic concoction: rent-backed structured securities that are even worse than the mortgage-backed structured securities that helped take down the financial system only a few years ago.
It worked. Each wave of buying ratcheted up prices via the multiplier effect, not only in the neighborhood but beyond. It created instant and juicy paper gains on all prior purchases. In this way, the same companies, now mega-landlords, were able to push up the value of their own holdings with new waves of purchases. It was a wonderful game while it lasted. And it was funded with nearly free money the Fed graciously made available to the largest players. Housing Bubble 2 came into full bloom.
But these billions of dollars being pumped into the housing market had the effect of pushing prices out of reach for many potential homeowners who’d actually live in these homes. And first-time buyers, the bedrock of the housing market? Well, forget it. Their share of purchases dropped to 33%, the lowest since 1987.
These inflated prices had another effect: the buy-to-rent business model collapsed. Rents were rising, but people are strung out, and so rents couldn’t rise fast enough to keep up with soaring home prices. At some point, depending on the dynamics of the metro area, the buy-to-rent equation stopped working. And now institutional investors have massively thrown in the towel:
Sales to institutional investors in the third quarter plunged to 4.3% of all sales, RealtyTrac reported. It was the lowest level since Q4 2010. The big unwind.
This is how the “smart money,” coddled by the Fed and encouraged to do just these sorts of things, has reacted to the recent home prices that it so strenuously inflated: It bailed out.
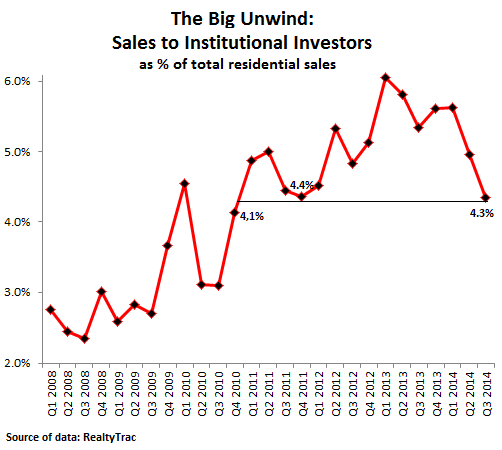
This chart shows that the peak of institutional frenzy occurred in Q1 of 2013. After that, institutional investors – defined by RealtyTrac as entities that purchase at least 10 properties per year – started having second thoughts about the new price levels in some of the hottest markets. But other markets hadn’t caught up, and investors shifted their focus to them. The national averages initially covered up much of the drama on the ground.
Institutional investors are still active, but much less so on a national basis, and they “continue to gravitate toward markets where lower-end inventory is still available,” said RealtyTrac VP Daren Blomquist. And when they’ve pushed this lower-end inventory out of reach for the strung-out American middle class, they’ll throw in the towel there too.
While the hottest markets for institutional investors in the early stages of Housing Bubble 2 used to be Las Vegas and Phoenix, the money guns are now trained on markets that they originally neglected. These are the latest hotspots:

While Memphis was number one in the third quarter, its institutional investor share of 16.4% was actually down from 20.3% a year ago. But some metro areas had year-over-year increases, including most notably Miami from 6.3% to 8.6%, Tampa from 7.5% to 8.6%, and Knoxville from 4.5% to 7.0%. These ups and downs by metro area indicate how the “smart money” comes and goes in waves, focusing on specific markets to ratchet up prices that will provide them with instant paper gains. And not much later, they’ll collect a pile of cash from the securitization of rents.
They did exactly what the Fed in its genius wanted them to do. In the process, they turned homes into an asset class for Wall Street firms and further deflated the American Dream of homeownership [The American Dream Going Bust – in One Chart].
But now what eventually had to happen has started to happen: as investors bailed out of the housing market due to prices that are too high for their business models, and as potential first-time buyers can’t get in due to those prices, sales have swooned for over a year. Initially, prices were still skyrocketing, but earlier this year, price increases started dissipating. And now, prices of new homes have turned south as Housing Bubble 2 pops in its full glory. Read… New Home Prices Plunge the Worst EVER (in One Ugly Chart)
No comments:
Post a Comment